Investment Calculators and Assessments
Each free calculator and assessment below is a working tool, not a demo: change the inputs and the results update instantly, with the formula explained in plain terms so you can check the math yourself. They cover the decisions that actually move returns — how much to commit to a single position, what fees quietly cost over a decade, what a monthly buying habit does to your average price, and whether a cash-burning company you hold can outlast its own spending.
Calculators
Plug in your own numbers and see the result update instantly.
- Open calculator →
Investment Fee Comparison
See what a traditional advisor, a robo-advisor and a plain index ETF each cost you over time, and what the gap is worth at the end.
- Open calculator →
Compound Growth Calculator
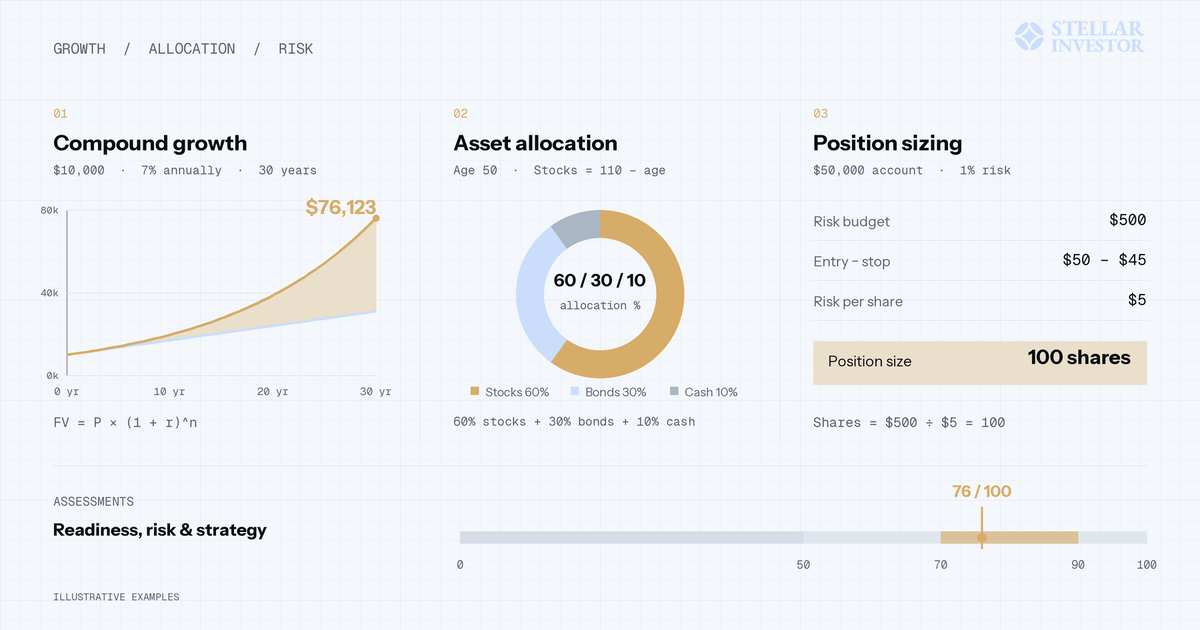
Project what a starting balance plus regular monthly contributions becomes over time, and see how much of the end figure is growth rather than what you put in.
- Open calculator →
Dollar-Cost Averaging Calculator
Model what buying the same dollar amount every month does to your ending value and your average cost, in a holding volatile enough for the timing to matter.
- Open calculator →
Position Sizing Calculator
Work backwards from the loss you are willing to take to the position size that produces it, rather than picking a share count and hoping.
- Open calculator →
Cash Runway Calculator
Estimate how many quarters a cash-burning company can fund itself, and whether growing revenue arrives before the balance does not.
- Open calculator →
Share Dilution Calculator
See what a capital raise does to your ownership stake, and what the company gets in exchange for it.
- Open calculator →
ETF Expense Ratio Calculator
Compare two funds that hold roughly the same thing at different expense ratios, and price the difference in dollars rather than basis points.
- Open calculator →
Personalized Asset Allocation Calculator
Pick your age, time horizon, risk tolerance and goal, fine-tune the starting mix with sliders, then generate a pie chart and example funds for each asset class.
- Open calculator →
Debt Payoff Calculator
See how many months until you are debt-free, the total interest you will pay, and how much time and interest an extra monthly payment saves.
- Open calculator →
AI Investing Fee Impact Calculator
Compare the original fee assumptions for a traditional advisor, an AI-managed ETF and a robo-advisor over a chosen investment period.
- Open calculator →
Tax-Loss Harvesting Impact Calculator
See how tax-loss harvesting—automatically selling investments at a loss to offset capital gains—can boost your after-tax returns.
Assessments
Answer a few questions to see where you stand and what to do next.
- Take assessment →
Risk Tolerance Assessment
Three questions on time horizon, income stability and how you react to a 20% drop, scored into a risk profile with a matching starting allocation.
- Take assessment →
Investment Readiness Assessment
Score your readiness to invest out of 100 from your emergency fund, credit card debt and monthly cash buffer, with specific steps to close any gaps.
- Take assessment →
Portfolio Rebalancing Checkup
Seven questions that estimate how far your portfolio has drifted from its target allocation and whether it is time to rebalance.
- Take assessment →
Money Mindset Self-Assessment
Ten questions that map how you think about money across abundance, scarcity, practical and avoidant mindsets, with next steps for your dominant type.
- Take assessment →
Passive Income Strategy Assessment
Five questions on effort, budget, risk, comfort with new technology and timeline that point you toward the passive income strategies that fit you.
FAQ
How much of my portfolio should go into one stock?
It depends on your account size and how far the price can fall before you would be wrong. The position sizing calculator converts a risk percentage and a stop level into an exact share count, so a single loss stays a controlled fraction of your portfolio instead of a bet.
How much do fund fees really cost over time?
More than most investors expect. A 1% annual fee can consume a fifth or more of your final balance over a few decades of compounding. The ETF expense drag calculator and the fee comparison calculator show the dollar difference between two funds side by side.
Is dollar-cost averaging better than investing a lump sum?
Lump sums win mathematically more often, but dollar-cost averaging wins where it matters: it keeps you buying through drawdowns instead of waiting for certainty. The DCA volatility calculator shows how a fixed monthly purchase lowers your average price when markets fall.
Can I use these for crypto or companies I am researching?
Yes. Position sizing, compounding, DCA and the fee calculators work for any liquid asset. If you are researching a growth company, the cash runway calculator tells you how long its cash lasts at the current burn rate, and the dilution calculator shows what a new funding round does to your stake.
Do these calculators give investment advice?
No. They are math tools, not recommendations. Each page explains the formula it uses so you can verify the result, and the assumptions you enter are yours. Use them to pressure-test your own plan — or a pitch you have been handed — before money moves.
Free newsletter · Every Wednesday
The Investing Frontier Newsletter
A weekly briefing on the companies and technologies building the next era of the economy — what is moving each sector, why it matters to investors, and the risks that come with it.
Free. Unsubscribe anytime.