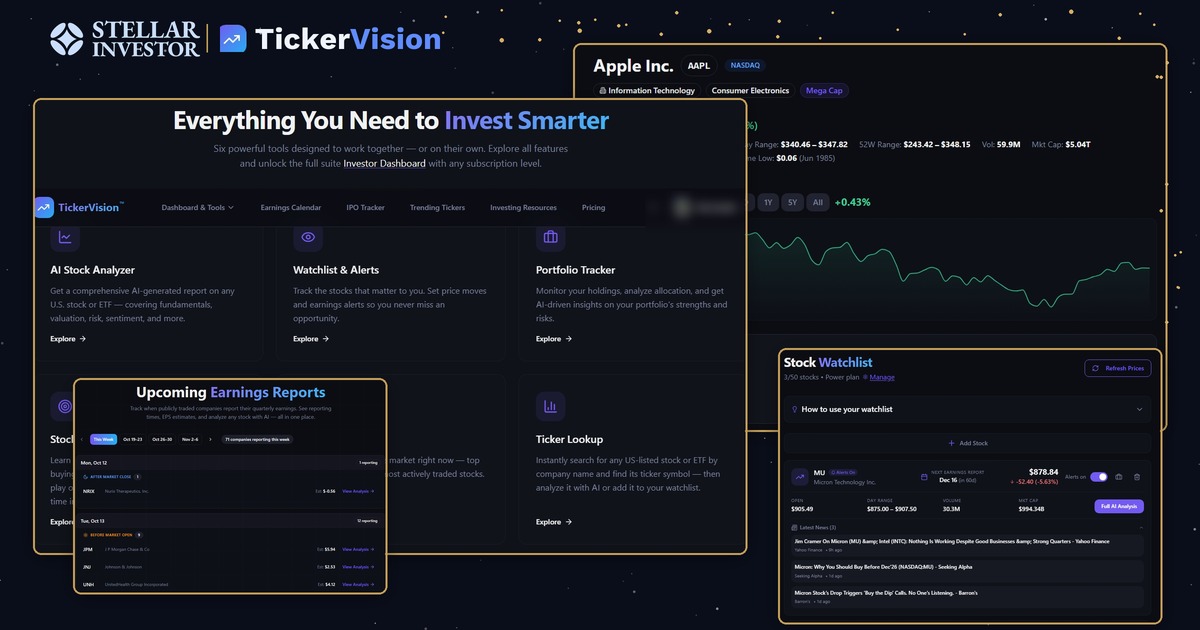
What TickerVision Is
TickerVision is a software tool designed to provide investors with a visual analysis of stock ticker data. It aims to help users understand the factors influencing price movements by presenting complex financial data in an accessible, graphical format. By integrating various data sources, TickerVision offers a comprehensive view of market dynamics, enabling investors to make informed decisions based on a clear understanding of underlying trends and patterns.
The tool aggregates data from multiple financial markets, including equities, commodities, and foreign exchange. It processes this information to generate visual representations such as charts, graphs, and heat maps. These visualizations highlight correlations, anomalies, and trends that might be less apparent in traditional numerical data formats. TickerVision’s interface is designed to be intuitive, allowing users to customize their analysis by selecting specific time frames, asset classes, and data overlays.
In addition to real-time data visualization, TickerVision provides historical data analysis, enabling users to compare current market conditions with past events. This feature helps in identifying recurring patterns and assessing the potential impact of similar situations on current investments. The tool also includes alert functionalities, notifying users of significant market movements or when specific conditions are met, based on predefined criteria.
TickerVision is accessible through a web-based platform, ensuring compatibility across various devices without the need for extensive software installations. The platform emphasizes user experience, offering a clean design that prioritizes clarity and ease of use. Regular updates ensure that the tool remains aligned with the latest market developments and technological advancements.
Who TickerVision Is For
TickerVision is tailored for self-directed retail investors who prefer to conduct their own market analysis without relying solely on third-party recommendations. It caters to individuals who value a hands-on approach to investing and seek tools that enhance their ability to interpret market data effectively.
The tool is particularly beneficial for investors with a foundational understanding of financial markets who wish to deepen their analytical capabilities. By providing visual representations of complex data, TickerVision makes it easier for users to identify trends and make informed decisions. This approach is especially useful for those who may find traditional numerical data presentations overwhelming or less intuitive.
Additionally, TickerVision serves active traders who require real-time data and alerts to respond promptly to market changes. The customizable features allow users to tailor the tool to their specific trading strategies and preferences. While it is designed with the individual investor in mind, financial advisors and professionals may also find value in its comprehensive visual analysis capabilities.
The standout features in practice
Real-time data visualization
TickerVision’s real-time data visualization feature provides users with up-to-the-minute graphical representations of market data. This functionality allows investors to monitor price movements, volume changes, and other critical metrics as they happen. By presenting data in a visual format, users can quickly grasp market dynamics and identify emerging trends without sifting through extensive numerical data.
The platform offers various chart types, including line charts, candlestick charts, and bar charts, each customizable to suit individual preferences. Users can overlay multiple indicators, such as moving averages and Bollinger Bands, to enhance their analysis. The interactive nature of these charts enables users to zoom in on specific time frames or data points, facilitating a more detailed examination of market behavior.
Historical data analysis
Understanding past market behavior is crucial for making informed investment decisions. TickerVision’s historical data analysis feature allows users to access and analyze data from previous market periods. This capability helps in identifying patterns, assessing the impact of historical events on asset prices, and drawing parallels to current market conditions.
Users can compare different time periods, analyze the performance of specific assets over time, and evaluate the effectiveness of various investment strategies. The tool provides filters to narrow down data based on criteria such as date range, asset class, and market sector, enabling a focused analysis tailored to the user’s interests.
Customizable alerts
Staying informed about significant market movements is essential for timely decision-making. TickerVision’s customizable alerts feature enables users to set specific criteria for notifications. These alerts can be based on price thresholds, percentage changes, volume spikes, or other user-defined conditions.
When the set conditions are met, the system sends notifications via email or in-platform messages, ensuring that users are promptly informed of relevant market events. This feature helps investors stay proactive, allowing them to respond swiftly to opportunities or risks without constant manual monitoring of the markets.
User-friendly interface
A key aspect of TickerVision is its user-friendly interface, designed to make complex data accessible to a broad range of investors. The platform’s clean layout and intuitive navigation ensure that users can easily access the features they need without a steep learning curve.
The dashboard provides a comprehensive overview of the user’s selected markets and assets, with quick access to detailed analyses and visualizations. Customization options allow users to tailor the interface to their preferences, such as choosing specific color schemes, arranging widgets, and setting default views. This personalization enhances the user experience, making the tool more engaging and efficient.
Pricing
TickerVision offers a tiered pricing structure to accommodate different user needs and budgets. The basic plan provides access to core features, including real-time data visualization and historical data analysis, suitable for casual investors seeking fundamental market insights.
The premium plan includes advanced features such as customizable alerts, additional data overlays, and enhanced customization options. This plan is designed for active traders and investors who require more sophisticated tools for in-depth analysis and timely decision-making.
A professional plan is available for financial advisors and institutional users, offering comprehensive data access, advanced analytical tools, and priority customer support. This plan caters to users who need extensive resources and functionalities to manage multiple clients or large portfolios.
TickerVision provides a free trial period for new users to explore the platform’s features before committing to a subscription. This trial allows potential subscribers to assess the tool’s suitability for their investment strategies and preferences.
Honest Limitations
While TickerVision offers extensive features, some advanced functionalities are limited to higher-tier plans. Users should assess their specific needs to choose the appropriate subscription level.
Verdict
TickerVision stands out as a valuable tool for self-directed investors seeking to enhance their market analysis through visual data representation. Its combination of real-time data visualization, historical analysis, customizable alerts, and a user-friendly interface makes it a comprehensive solution for understanding market dynamics.
The tiered pricing structure ensures that TickerVision is accessible to a wide range of users, from casual investors to financial professionals. By offering a free trial period, the platform allows users to evaluate its features and determine its alignment with their investment goals. Overall, TickerVision provides a robust and flexible toolset for investors aiming to make informed decisions based on clear and comprehensive market insights.